BE SMART. BE ALTERNATIVE.
Location hotspots that convert and developments that are backed by decades of experience and industry leaders who know the process inside out.
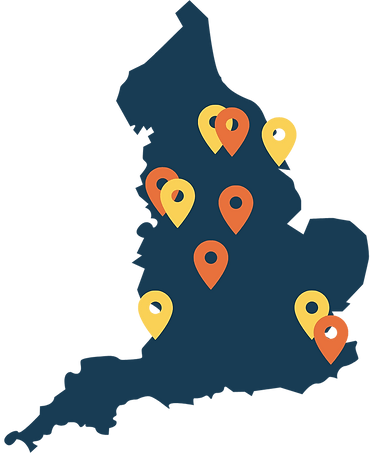
"Overall, sold prices in Manchester over the last year were 6% up on the previous year and 21% up on the 2019 peak of £206,300."
"Overall, sold prices in Preston over the last year were 2% up on the previous year and 7% up on the 2019 peak of £170,665."
"Overall, sold prices around Birmingham over the last year were 4% up on the previous year and 18% up on the 2019 peak of £217,816."
"Overall, sold prices in Bristol over the last year were 1% up on the previous year and 15% up on the 2019 peak of £315,393."
"Overall, sold prices in Ashford, Kent over the last year were 2% up on the previous year and 10% up on the 2018 peak of £277,136."
"Overall, sold prices in Sheffield over the last year were similar to the previous year and 12% up on the 2019 peak of £201,000."
"Overall, sold prices in London over the last year were 2% up on the previous year and 8% up on the 2019 peak of £740,146."
"Overall, sold prices in Leeds over the last year were similar to the previous year and 16% up on the 2019 peak of £220,788."
"Overall, sold prices in Bradford over the last year were 3% down on the previous year and 5% up on the 2019 peak of £137,775."
Overall, sold prices in Hull over the last year were 4% down on the previous year and 5% up on the 2019 peak of £146,056."
- or -


.png)